
Architecture Technology Corporation is supporting the U.S. Navy in their transition to new software and hardware architectures for the Joint Mission Planning System (JMPS). Our targeted code profiler, Typhon™, helps pinpoint scalability issues in CPU and memory usage among large code bases such as JMPS.
 Typhon automatically runs the application under test and records performance and memory data as the user interacts with the application. Typhon then compares performance and memory data from multiple profiling executions to identify methods whose performance has changed the most and identify performance bottlenecks based on user-specified input as well as to identify peaks in memory use. Typhon supports .NET applications including managed languages (C#, F#, Visual Basic.NET) and native languages (C++, Visual Basic 6).
Typhon quickly identifies performance-limiting functions and excessive memory use in a software application without requiring time-consuming recompilation or source-level access. With the Typhon profiler, a user can focus data collection of particular areas of the code by selecting files, classes, and/or methods to target during profiling. This unique method of targeted profiling reduces the amount of data gathered and displayed and further reduces profiling overhead, significantly saving time and dramatically increasing reliability. The user is presented with the timing data to support decision making without being inundated with unneeded data.
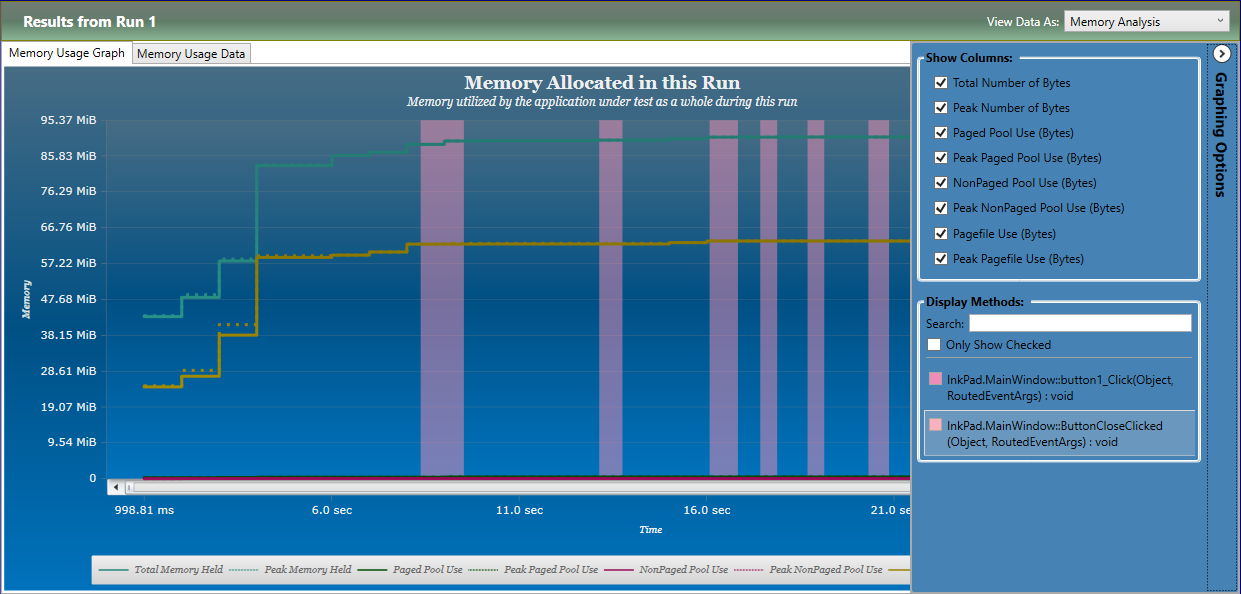
Typhon’s memory profiler keeps track of the total number of bytes used by the application. The memory profiler can also identify which methods were active when memory usage spikes or dips occur. Typhon features easy user access to many tools for analyzing profiling data, ranging from mathematical analysis to visualizations and graphs for easy identification of performance problems. This intuitive interface minimizes the training needed for operators and software developers.
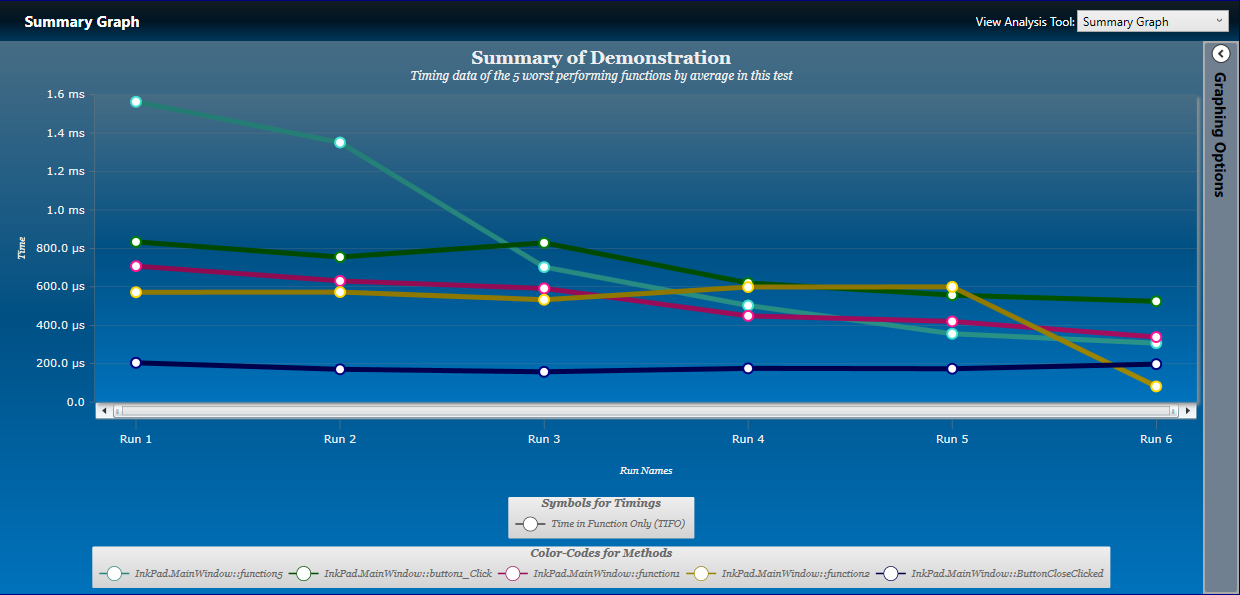
Typhon enables developers to identify performance and memory problems in software prior to deployment of the software, when it is easier and requires less resources to fix any problems that are found. Using Typhon, developers can adjust their profiling configuration to investigate the performance and memory of their application broadly or in a targeted fashion. Typhon helps developers quickly identify poorly-scaling or otherwise data-dependent functions in a large code base. While existing profilers generally only show the user which functions are slow within a given performance run, Typhon provides the option to run the same code over multiple dataset sizes and instantly pinpoint functions that scale poorly based on the different inputs used over several runs. These benefits apply to both DoD and commercial entities that develop software.
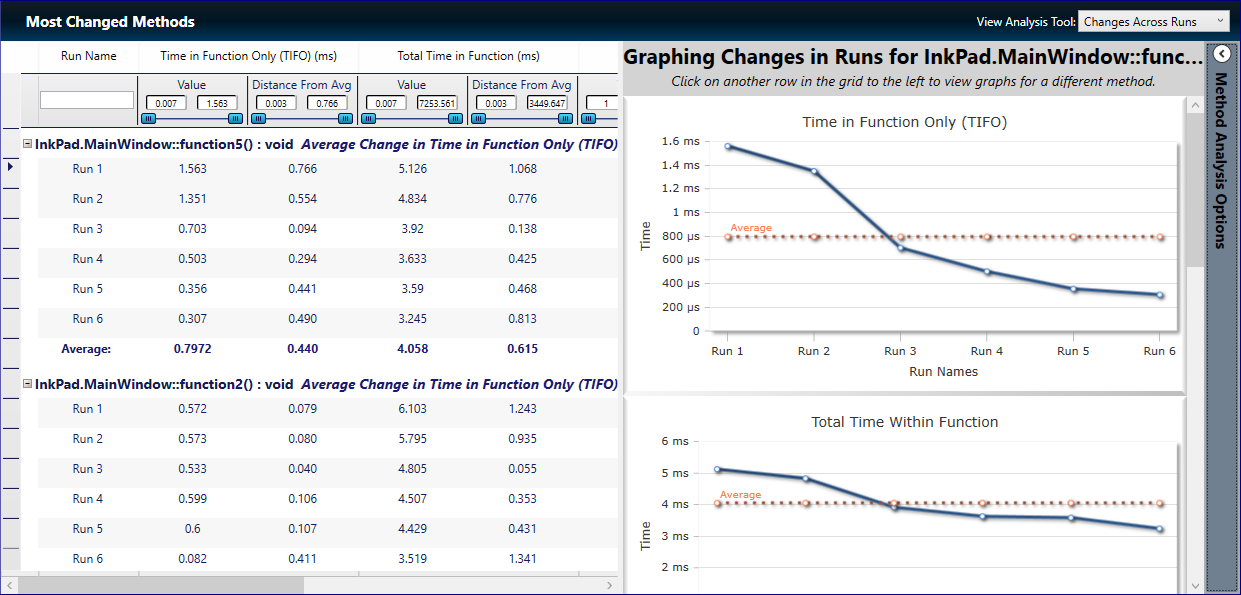
Typhon features several analysis tools for users to thoroughly investigate the data retrieved from the profiling runs. For performance profiling runs, Typhon offers features to view the time spent in each function as well as the execution path of the functions. Users can also view a graph of each call of a specific function within a run. For memory profiling runs, users can view the flat memory data as well as a graph displaying the data use across an entire run and within functions. Typhon also features several tools to compare performance and memory use between runs within the same test.
Architecture Technology Corporation is actively working with the U.S. Navy to help improve JMPS code by using Typhon.
Contact us at typhon@atcorp.com for more information.